Professional work · Jan 2024 to present
Weekly KPI reporting
A weekly management reporting cycle covering more than 70 business metrics for Data Career Jumpstart.
- 70+
- business metrics
- 8h to 5h
- weekly preparation
- Weekly
- management reporting cycle
The challenge
Make a recurring report easier to prepare and easier to review.
The report drew from several recurring business activities. Preparation involved repeated manual checks, and unclear definitions made review slower than it needed to be.
What I did
Built a repeatable weekly process.
- Prepared and checked the weekly source data.
- Maintained metric definitions, templates, and the reporting calendar.
- Built the management summary and answered follow-up questions.
- Created focused views for common webinar and podcast questions.
- Wrote down the reporting steps so another person could follow them.
The method
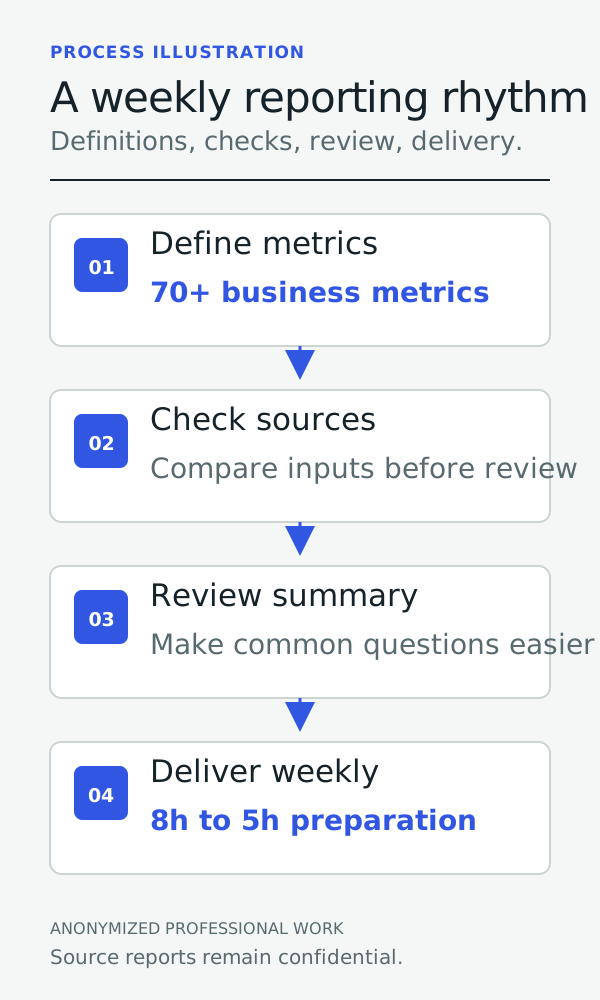
Check the inputs before the report reaches review.
I maintained the definitions and reporting calendar, checked the source data, then prepared the management summary. Written steps made the cycle easier to repeat and hand over.
Result
Standardizing the workflow cut preparation from about eight hours to five per cycle. It also made recurring questions easier to answer without rebuilding the same analysis each time.
Tools
Excel, Google Sheets, reporting dashboards, and written process notes.
Confidential
Internal reports, source data, and company workbooks are confidential.
Contact
Interested in this kind of work?
Copy my email address, then send a note about the role, project, or reporting problem you are working on.
Copy email